- Reclamation
- TSC Home
- Software
- WinADV
WinADV
A Windows-based viewing and post-processing utility for ADV files
WinADV Version 2.031 was made available November 26, 2013.
Notable recent changes:
- Version 2.031 fixes a problem with adjustments made for moving probe measurements
- Version 2.030 improves capabilities related to processing files from the command line interface.
- Version 2.029 adds ability to specify a flag file from the command line and adds feature to display probe transformation matrix details.
- Version 2.028 fixes an error in the implementation of phase space despiking.
- Version 2.027 fixes problems with "spikes" appearing in histogram plots of COR and SNR.
- Version 2.026 fixes problems with filtered processing of files containing data from multiple probes.
- Version 2.025 fixes problems with the loading of files that were recorded with a USER velocity range.
- Version 2.024 fixes minor problems related to Vectrino files and histograms
- Version 2.023 does a better job of allowing one to effectively process a file with missing flags.
- Version 2.022 fixes a problem with applying plane rotation coordinate transforms to multiple files.
- Version 2.021 provides the ability to export histogram chart data to the system clipboard.
- Version 2.020 is an important upgrade that fixes a potentially serious problem related to coordinate transformations. Users should upgrade to this version and check the results from any files processed with versions 2.017 through 2.019.
- Version 2.015 and later can load files recorded by Nortek Vectrino probes. Before loading into WinADV, the native VNO data file must be converted to the *.adv file format using a utility provided by Nortek.
- See the Revision History Page for more details of recent revisions.
Documentation for WinADV
User's manuals and on-line help are provided with the software. An overview of the software and its use are given in the ASCE conference paper "Analyzing ADV Data Using WinADV"WinADV OVERVIEW
WinADV provides an integrated environment for viewing, reviewing, and processing data collected using SonTek and Nortek acoustic Doppler velocimeters (ADV's). WinADV was written for Windows 95/NT, using Visual Basic 4.0.
WinADV was created for several purposes:
- To permit easy, visual review of ADV data files in the office following data collection
- To simplify filtering of data and aid in the identification of anomalies caused by low signal strength or overranging of the ADV probe
- To simplify processing of data collected using flag markers, and permit various schemes for the use of flag markers during data collection
- To simplify the analysis of ADV data collected from moving probes
- To simplify the analysis of ADV data collected under harsh field conditions where marking of flag points and diligent attention to signal quality are more difficult
- To permit batch processing of large numbers of ADV data files
- To minimize the need for manipulating and analyzing large quantities of time series data
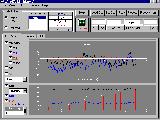
 The main WinADV screen (this link provides better views) presents velocity and signal quality data in graphical form. The user may select parameters for plotting, zoom in on portions of the data set, or select probes from files containing data for multiple ADV probes. Additional screens summarize ADV configuration data, adjust WinADV's filtering and sampling options, preview summary statistics, and process files to produce data files and summary statistics that can be imported to spreadsheets, graphics or other analysis software.
WinADV provides the capability to quickly view time series graphs, histograms, or FFT's of the various velocity data. Data may be filtered on-the-fly and sampling windows may be established so that only relevant data are plotted. For data collected from moving, or traversing probes, an equation describing the position of the probe as a function of time may be entered so that ADV data may be directly plotted versus probe position. Velocity data can be transformed from model to prototype scale using scaling factors. Filtering, sampling, traversing, and scaling options may be saved for later use.
For those cases in which field conditions limit your ability to mark the data file with flags, a flag editing dialog box allows for the attachment of an after-the-fact flag file to the data for use in data processing.
WinADV provides routines for processing entire ADV files or portions of ADV files defined by sampling windows to obtain average velocities, turbulence parameters, and aggregated measures of data quality. A single ADV file may be viewed and processed, or collections of ADV files may be processed as a group. Summary statistics for filtered and/or unfiltered data may be output in suitable formats for import into Lotus 1-2-3, Microsoft Excel, or other graphics or analysis software. Time series data files combining velocity, signal amplitude, correlation, signal-to-noise ratio, and analog/digital data may also be produced.

